How much fit signal survives into synthetic try-on images? A real-world measurement
By Fittings Labs Team
Can synthetic try-on pipelines capture real-world fit — or does the link between measurement and appearance weaken somewhere along the way?
As generative models advance, the frontier question for virtual try-on is shifting from visual realism to size fidelity: whether an image reflects how a garment actually sits, drapes, and folds at a given size on a given body. We started Fittings Labs on that question, and we collect the one thing that can answer it — real photographs of the same person in the same garment across sizes, with taped measurements on both body and garment.
To measure the sim-to-real gap, we tested against the state of the art: the FIT dataset (SIGGRAPH 2026, UW + Google Research), which attached precise body and garment measurements to over a million synthetic try-on images so that models could be supervised on fit, not just appearance. Releasing this data publicly is what makes independent measurements like ours possible — credit to the authors for that openness. They were also notably candid about a limitation: in their pipeline, a tight garment and a very tight garment render almost identically — "fitted to the skin" — so varying degrees of tightness are underrepresented.
That candor gave our question a concrete, checkable form:
- ●How large is the disclosed gap, quantitatively, when checked against real-world ground truth?
- ●Is it confined to the tight end — or does the link between annotated measurements and visible drape weaken across the whole ease spectrum?
Below is a small, pre-registered probe. Within its scope, the answers: the gap is measurable and substantial — and it is not confined to tightness.
Setup
The real side. One controlled multi-size session: the same person wearing the same sleeveless cotton top (100% cotton) in sizes S, M, and L, photographed minutes apart in the same location. Garment measurements taped on the physical garments; body measurements taped on the contributor. The resulting body–garment bust deltas: −3.5 cm (S), +5.5 cm (M), +11.5 cm (L) — a spectrum from negative ease (stretch-fitted) to generous ease.
The synthetic side. From FIT's public 100K preview, we streamed the sleeveless subset and sampled 75 images into five delta-matched buckets: three matching our real deltas (±1.5 cm), one strongly negative (−6 cm and below), one loose control (+7 cm and above). Fifteen samples per bucket; every bucket filled.
The metric. Both domains pass through an identical pipeline: crop a center strip of the worn garment, resize to a fixed resolution, percentile-normalize contrast, then measure fold activity — the fraction of pixels with strong gradient energy, i.e., how much the fabric is visibly folding, draping, or wrinkling. This deliberately avoids cross-domain confounds from resolution and rendering style: we compare trends against delta within each domain, not absolute values across domains.
Pre-registered reading. Before running the comparison, we fixed the interpretation: if synthetic fold activity tracks delta the way real fabric does, real capture adds little here; if the visible drape is unrelated to the annotated measurements, it quantifies how much of the fit signal the synthetic channel is missing.
Results
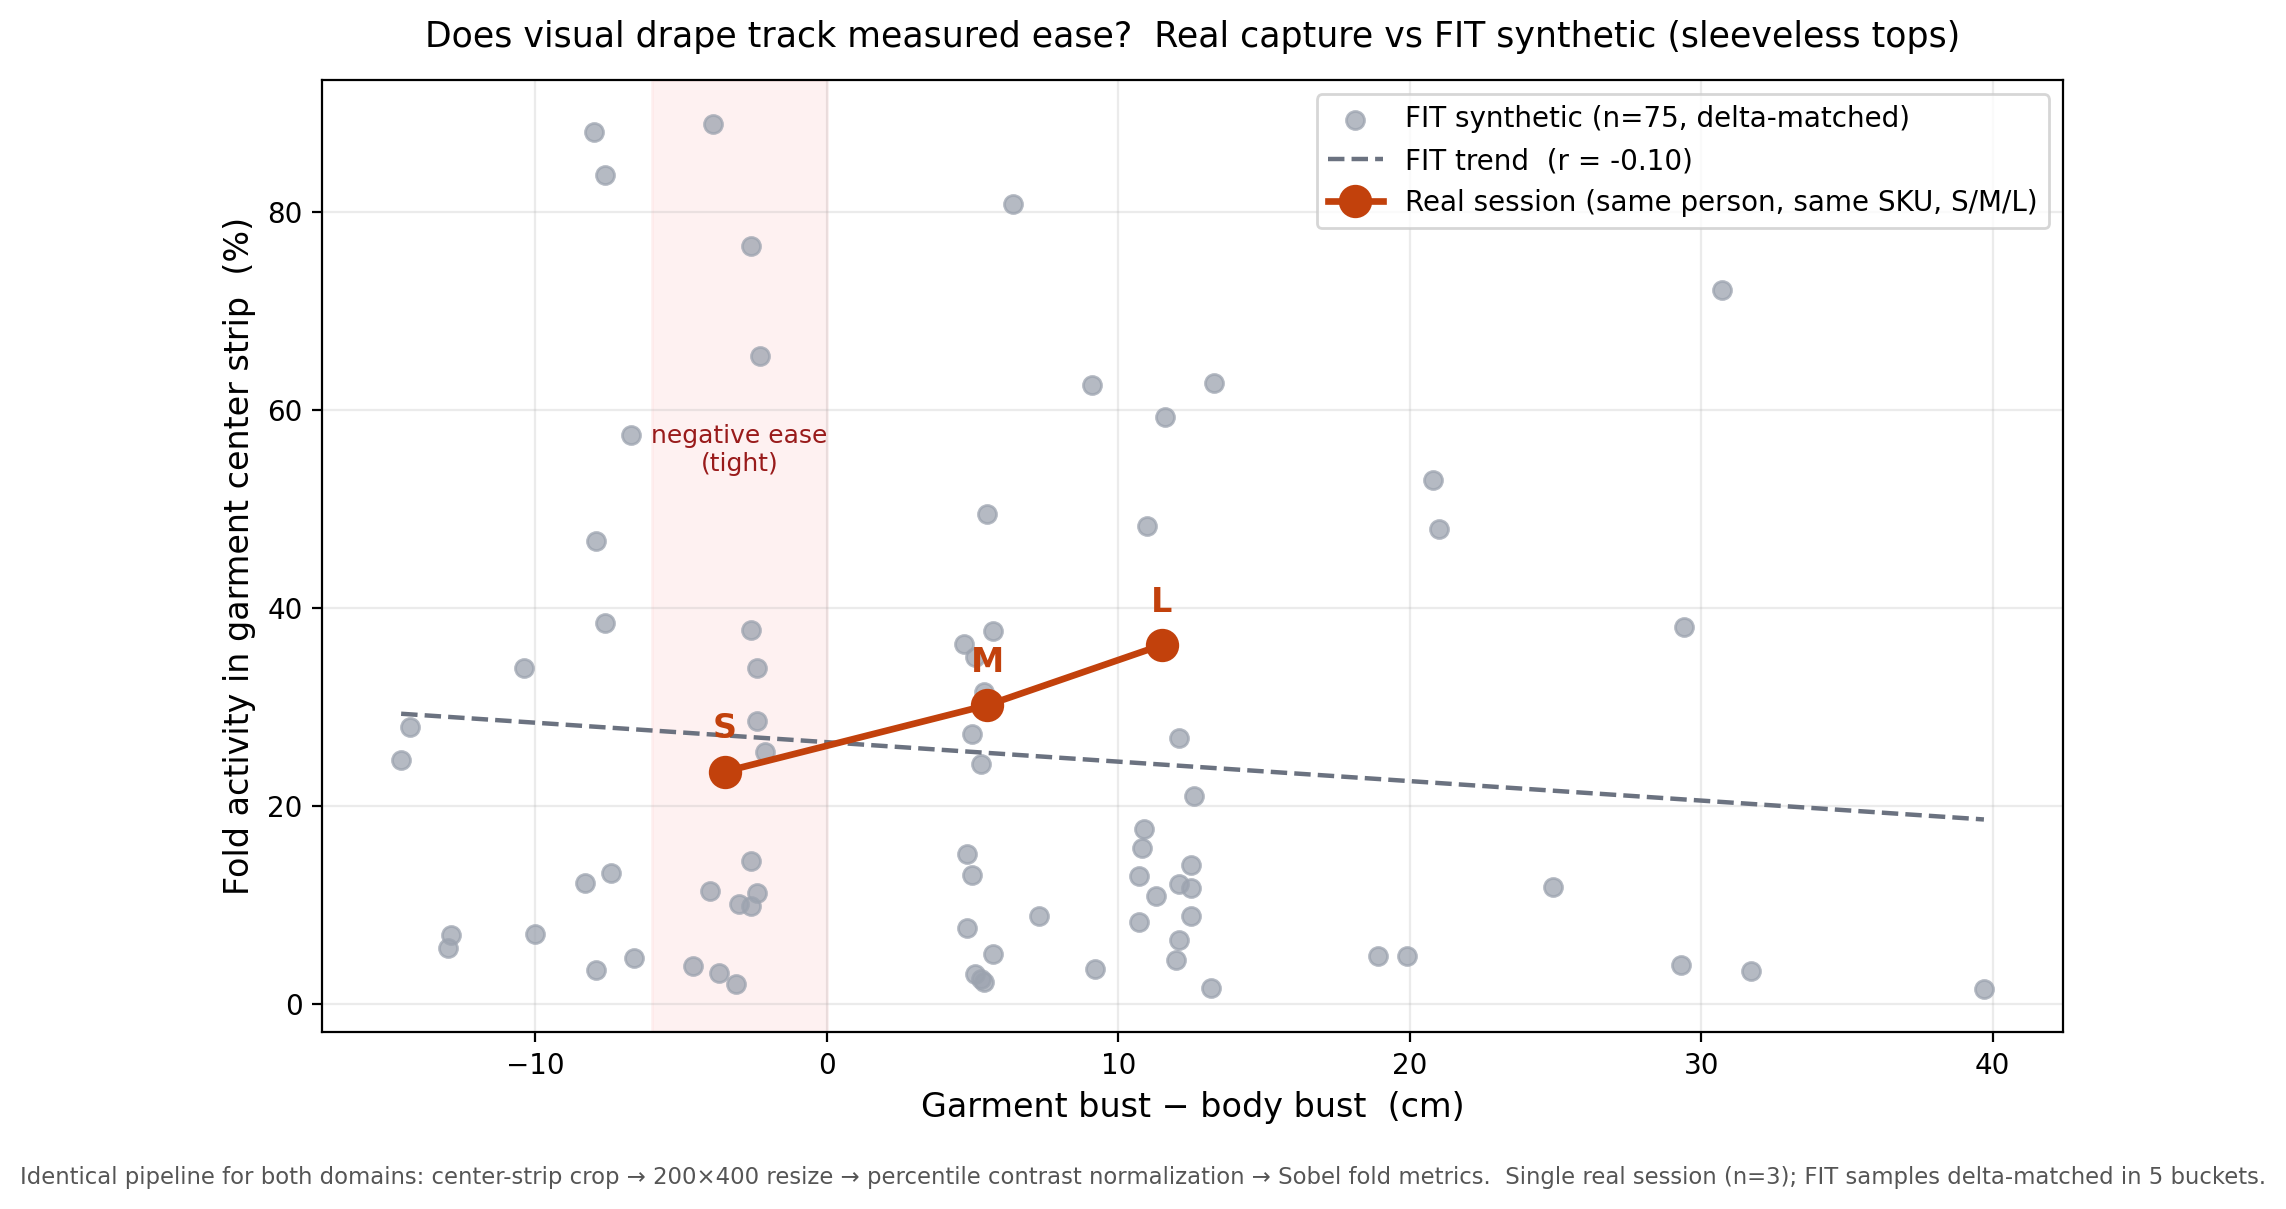
Fold activity vs. body–garment delta. Gray: 75 delta-matched FIT samples with trend line (r = −0.10). Orange: the real S/M/L session, same person, same SKU.
CaptionReal fold activity rises monotonically with ease (23.5% → 30.2% → 36.3%, S to L); synthetic fold activity does not move with the annotated delta at all (r = −0.10). The correlation the field needs for fit-aware training is present in the real photographs and absent from the synthetic renders.
In the real captures, drape tracks ease monotonically. Fold activity rises 23.5% (S, −3.5 cm) → 30.2% (M, +5.5 cm) → 36.3% (L, +11.5 cm). More ease, more visible drape — the image expresses the measurement. (In the un-normalized pixel domain the effect is even sharper: fold-pixel density rises roughly 8× between M and L, as ease crosses from "absorbed by silhouette width" into "spilling over as folds".)
In the synthetic samples, we could not detect that relationship. Across 75 delta-matched images, fold activity shows essentially no correlation with the annotated ease (r = −0.10), and per-bucket distributions overlap almost completely. This is consistent with the authors' own tightness caveat — and it appears to extend beyond it: the pattern is just as flat on the loose side, where the bucket with the most ease (+20 cm and beyond) shows the lowest median fold activity (8.9%). In these renders, garments with two hand-widths of ease show smoother surfaces than fitted ones — whereas in our real captures, additional ease consistently produced additional drape.
Two distribution observations from the same scan seem worth recording. The sleeveless subset skews loose: median delta +10.7 cm, with roughly 14% of samples in negative ease — so the region where real sizing decisions concentrate is a thin tail of the synthetic distribution. And a coverage note: in the portion we scanned, garment bust starts around 92 cm and body bust around 83 cm; our real contributor (80.5 cm bust) falls below the smallest synthetic body we encountered, and our real S and M garments (77/86 cm) are smaller than any synthetic garment we saw. (Caveat: we scanned a prefix of the dataset, not all 100K — these are lower-bound observations, not totals.)
Reading the result
In the samples we examined, the visual channel carries less of the fit signal than the annotation layer does. A fit-aware model trained on these pairs receives measurement annotations whose visual consequences are largely absent from the images. It can learn to repeat the numbers; it has much less signal from which to learn what the numbers look like. This is consistent with a pattern widely observed in current try-on systems — every size rendering as a well-fitted garment — and it sharpens what the fix requires: data in which image and measurement agree, which is what controlled real capture provides by construction.
This does not tell us where in the pipeline the signal is lost. Two candidate explanations are indistinguishable from the outside: (a) the physics stage under-produces ease-dependent drape, or (b) the physics is right and the re-texturing stage smooths it away — a generative model trained on catalog photography pulling renders toward the well-fitted prior. The two are separable by running the same metric on pre-retexture renders; our metric pipeline is simple and we're glad to share it with anyone positioned to run that comparison.
Limitations, honestly. The real side is one session — one person, one SKU, three sizes: an existence proof under control, not a statistic. It is also the first session of a growing capture network; the per-category baselines we publish next will carry the sample sizes this probe lacks. The synthetic side is a 75-sample curated subset of one garment category. Garment-region localization on synthetic images is heuristic. We consider this a probe that motivates a benchmark, not the benchmark itself.
Where this goes
This probe is the seed of the evaluation we proposed in our previous post: a Real-world Size Fidelity benchmark — controlled same-person multi-size captures with taped measurements, held out as the referee for any fit-aware system, however trained. Synthetic data solves scale; real ground truth is what lets anyone measure how much of the fit signal survived. As our capture network grows, we'll publish baseline numbers across categories — starting where the stakes and the sim-to-real gap are largest: denim.
If you're building or evaluating fit-aware try-on and want to test against real multi-size ground truth, reach us at fittingslabs.co.
Method note: sample extraction script and metric definitions available on request. FIT preview data © its authors (CC-BY-NC-ND 4.0); no dataset images are reproduced in this post — samples are referenced by their public dataset indices in our results file.